
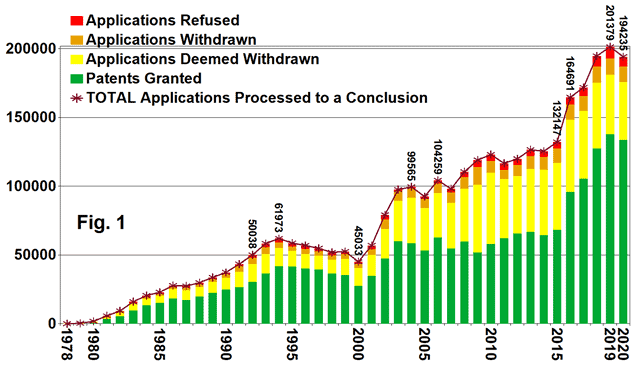
The number of European patent applications processed to a conclusion in each year (i.e. applications granted as patents, and applications refused, withdrawn or deemed withdrawn) has increased greatly, if not always continuously, since the EPO opened in 1978. In 2019 just over 200,000 applications were processed to a conclusion, with rapid growth in the year by year numbers of applications processed starting in 2015. The slight fall in 2020 may well be attributed to problems arising due to the Covid 19 pandemic. This is summarised in Fig. 1.
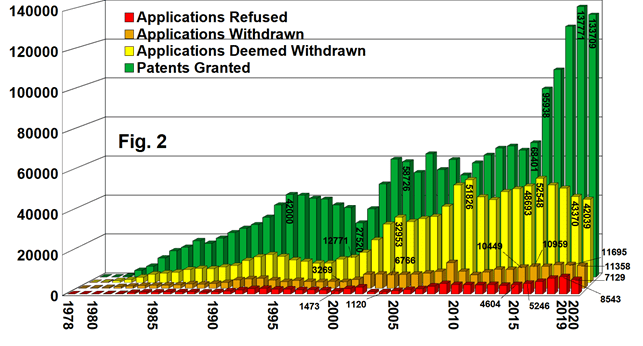
As can be appreciated from Fig. 2 the rapid growth from 2015 in year by year numbers of applications processed to a conclusion was due to growth in the numbers of patents granted. The numbers of grants in 2019 and 2020 were double the number of grants in 2015. Applications refused, withdrawn and deemed withdrawn year by year did together increase somewhat from 2015 to 2016 but then the numbers fell consistently.
As noted in Part 1 of this report, up to 2015 the EPO’s processing of applications more or less kept up with increasing numbers of new applications. More recently the numbers of applications processed each year have significantly exceeded the numbers of new applications published each year, predominantly based on the doubling of the numbers of grants. The “stock” or “backlog” of pending applications has been reduced. The growth has been achieved without significant increase in EPO resources in terms of examiners and total staff, as indicated in the table below (information taken from EPO reports).
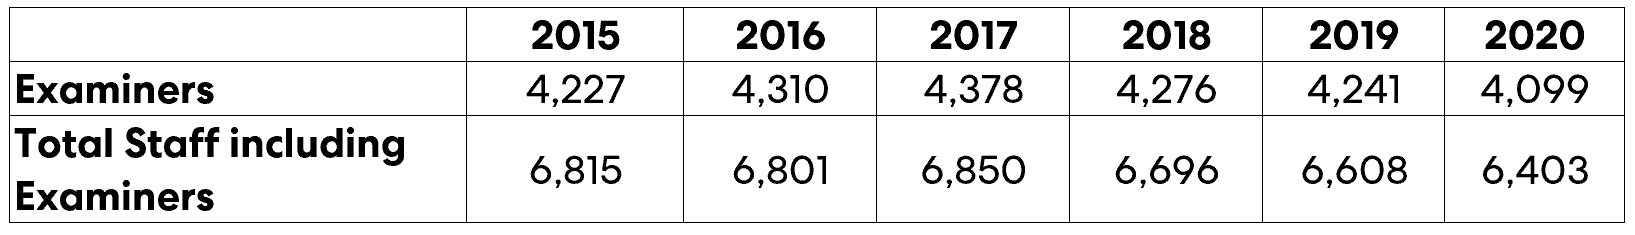
It seems plain that EPO procedures must have changed in order to facilitate a doubling in the number of patents granted since 2015. The EPO did introduce a new performance management system, closer monitoring of timeliness, a focus on clearing very old files, and a reduction in Examiner time spent on projects other than core examination duties. Productivity, i.e. the number of applications processed to a conclusion each year, has increased significantly. An interesting question is, have standards changed? Have patents been granted since 2015 which in earlier times would not have been granted?
As shown in Fig. 3 the growth from 2015 to 2019 in the numbers of patents granted year by year, unaccompanied by growth in the numbers of applications suffering less favourable fates, means that a greater proportion of applications were granted: 2015 52%; 2019 68% (2020 69%).
In this context it is noted that grant rates above 65% (darker green in Fig. 3), not unknown in the past, occurred only in years before 2000. On the other hand, grant rates less than 55% (lighter green in Fig. 3) occurred only in the seven years from 2008 to 2015, that being a period starting with the global financial crisis which led some applicants to reduce their portfolios of pending patent applications, bringing about record numbers of withdrawals and deemed withdrawals in 2009 and 2010. There is, of course, no “correct” grant rate and variation from year to year is to be expected, but grant rates between 55% and 65% might be seen as mainstream.
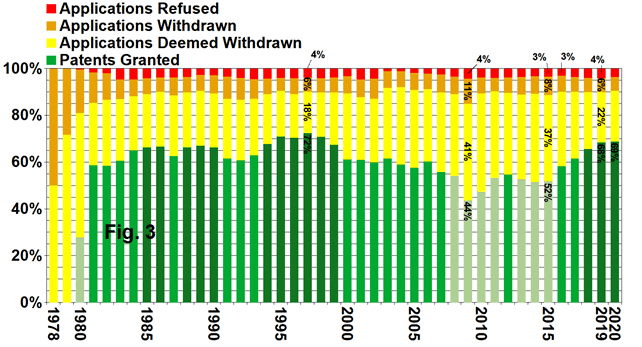
Another parameter that can be considered is the percentage of patents granted in relation to the percentage of applications refused. This ignores applications where processing is completed due to action (withdrawal) or inaction (deemed withdrawal due to failure to meet a deadline) of the applicant. From Fig. 3 above, for 2015 the ratio of refusals to grants is 3/52 = 0.058. For 2019 the ratio of refusals to grants is 4/68 = 0.059. The value of this parameter, based on proceedings brought to a close by an action of the EPO (grant or refusal), has thus barely changed.
This is for general information only and does not constitute legal advice. Should you require advice on this or any other topic then please contact hlk@hlk-ip.com or your usual Haseltine Lake Kempner advisor.