
We are entering the final stretch of 2023, and what better way to celebrate than to take a deep-dive into recent facts and figures coming from the EPO?
Many in the industry have questioned the quality of output from the EPO in recent years. Anecdotal reports suggest that EPO Examiners are routinely instructed “not to spend more than a certain amount of hours on a search or examination action” and “are being pressured to ignore non-important aspects […] in order to further speed up the process”. Supposedly, EPO Examiners have been issued guidance to focus on getting allowable cases allowed and granted. We have even heard that some applicants are grumbling about the rapid increase in the number of validations they are tasked with following the increase in numbers of issued Rule 71(3) communications.
But does this bear out in the data?
We won’t touch on EPO “quality” here – there’s plenty of discussion elsewhere for that. Instead, we will look at recent trends in patent grant rates at the EPO and consider some possible associated implications.
Recovery
According to information provided in the EPO’s Patent Index 2022 and Annual Review 2022, in 2022 the number of new European patent applications was 2.5 % (ca. 4,600) higher than in 2021. Compared to 2019 – the last year largely unaffected by the COVID-19 pandemic – there was an increase of 6.5 % (ca. 12,000) in the number of new applications in 2022[1].
As seen in Figure 1 below, after a strong increase from 2015 to 2019, the numbers of European patents granted soon began to fall. In 2022, the number of European patents granted was 25 % less (ca. 27,000) than in 2021. Compared to 2019, patent grants in 2022 were lower by 40 % (ca. 55,000). The fall in grants seems likely to reflect the impact and effects of the COVID-19 pandemic and challenges involved in the transition to remote- and hybrid-work by EPO staff.
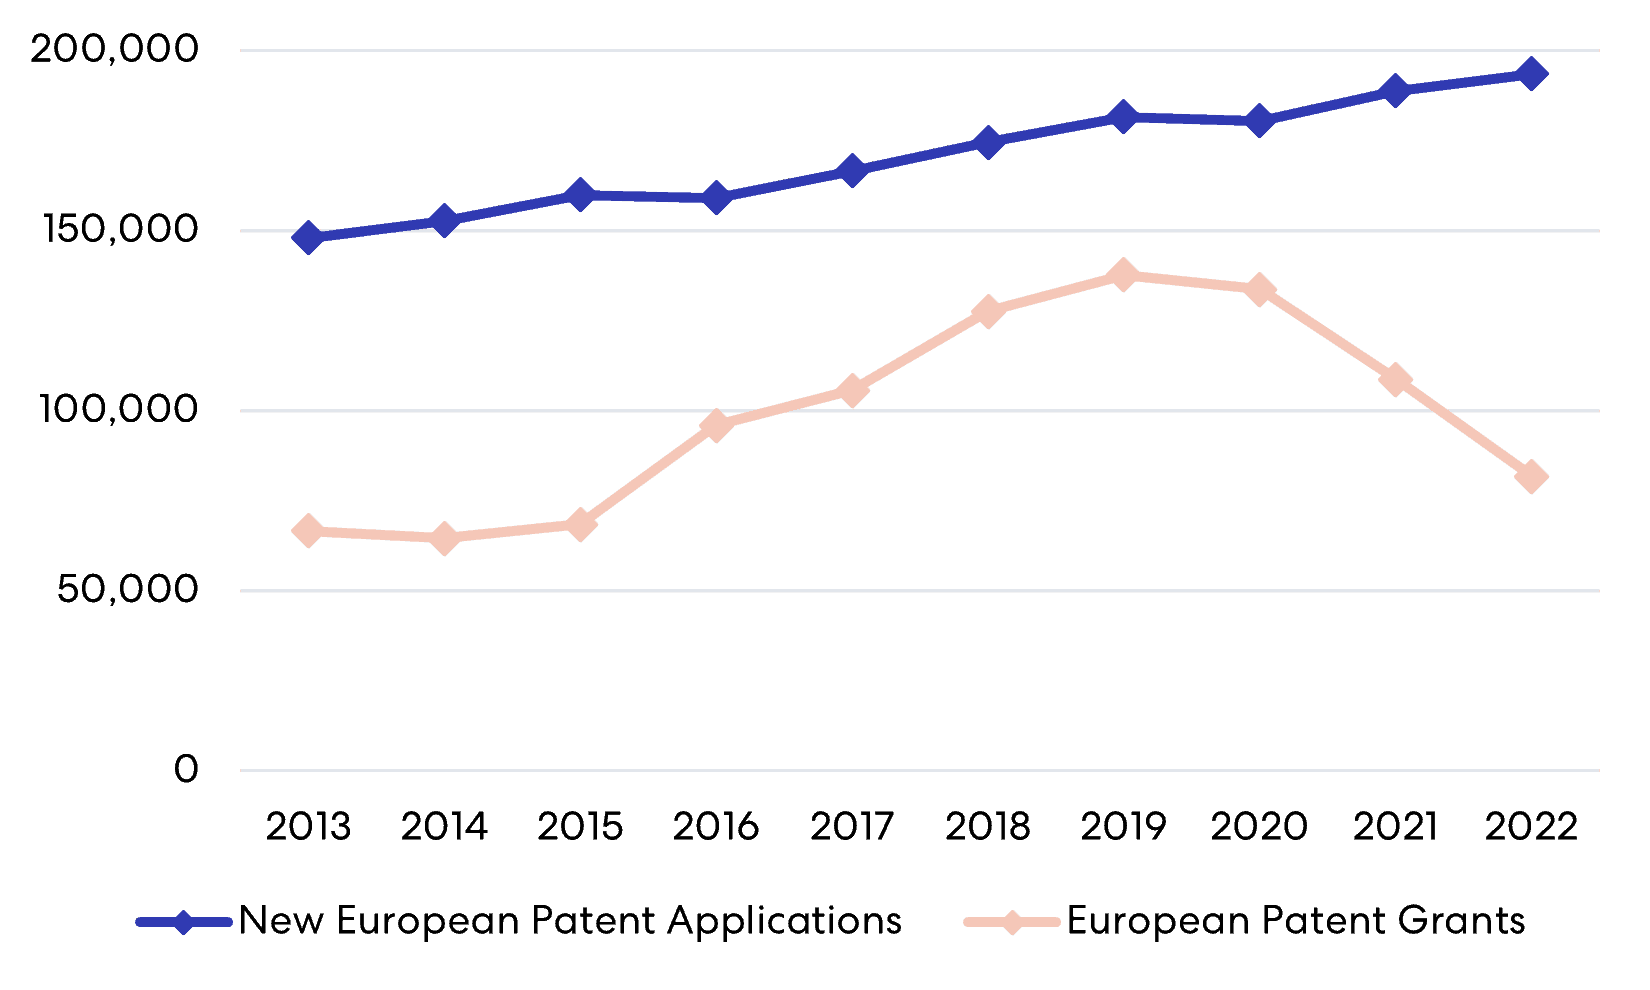
Figure 1 – EPO patent trends in the last 10 years
However, looking at the EPO’s EP Bulletin Search database, it appears that in 2023 there will be a recovery from the recent downward grant trend. Broadly, the number of allowed cases (cases for which a communication of intention to grant is issued) is a fair indicator of the number of patent grants about six months later (see Figure 2 below). On this basis, the number of allowed cases in the latter half of 2022 and the number allowed so far in 2023 supports a forecast of the number patent grants in 2023 at around 105,000 – a 25% increase over 2022’s total. This is more optimistic than the EPO’s Annual Review 2022, which “budgets” for around 96,000 grants in 2023[2].
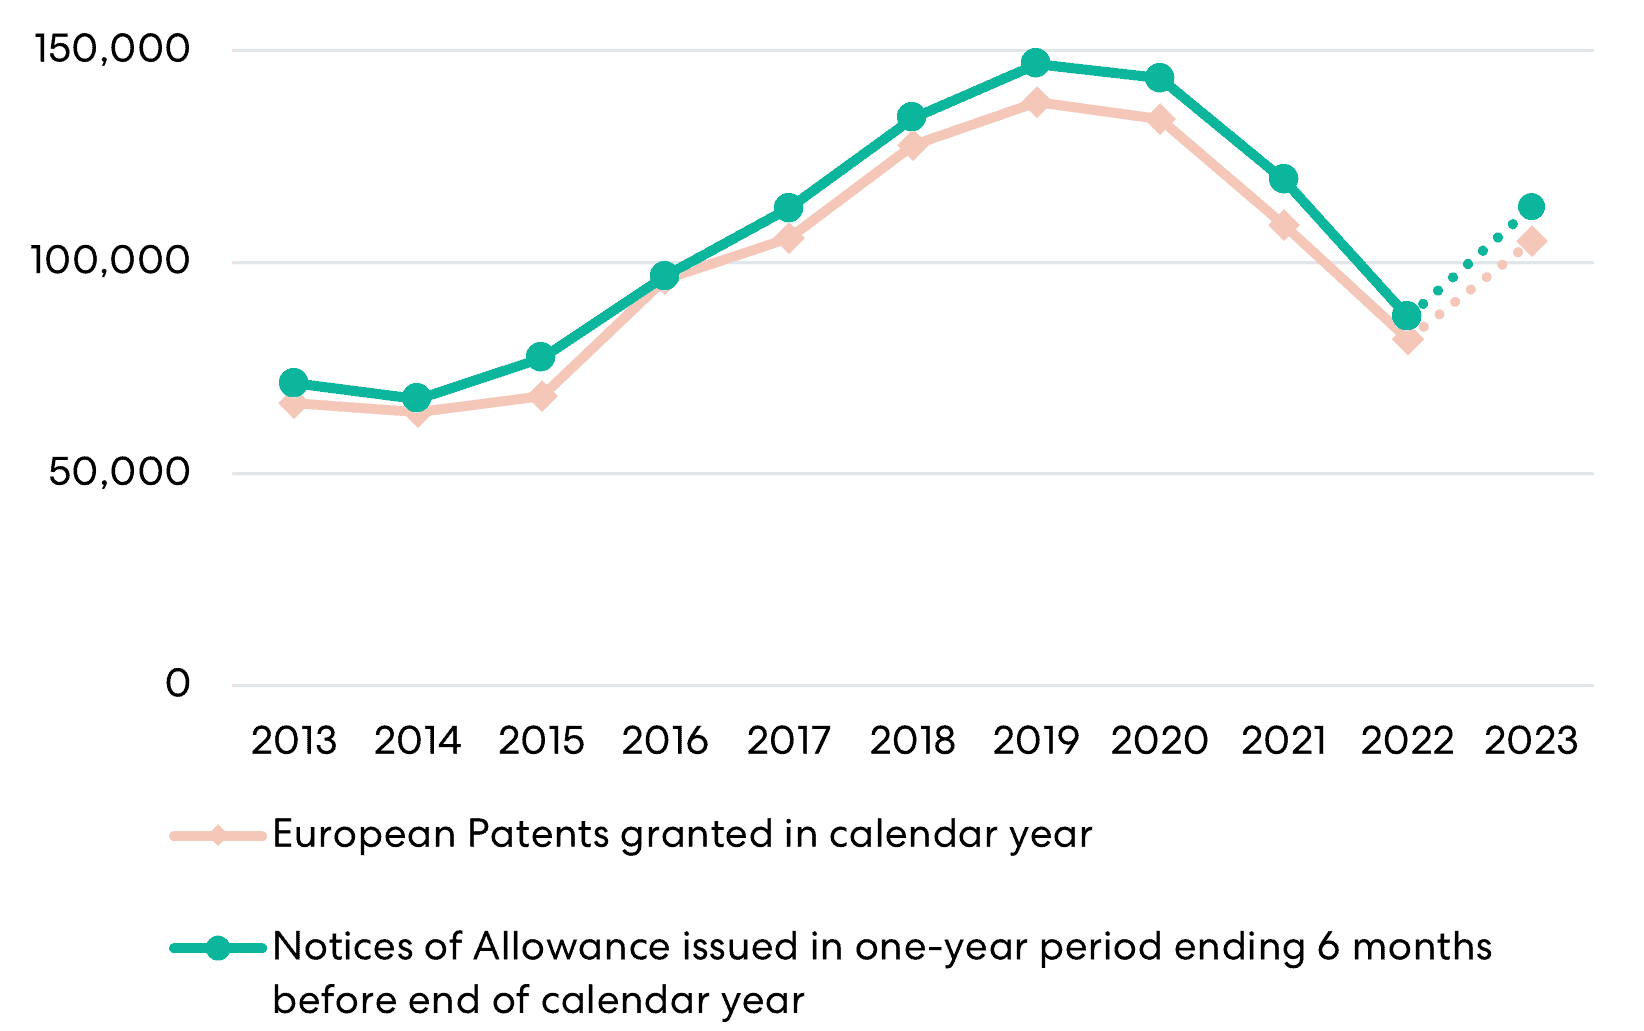
Figure 2 – EPO recent grants and number of notices of allowance, including 2023 forecast
That is to say, in line with the supposed EPO guidance to focus on getting cases to grant, it does appear that the number of cases proceeding to grant has rapidly increased in 2023. But how are the EPO achieving this?
Rejuvenation
In its Annual Review 2021, the EPO spoke of “targeted efforts to process old files and rejuvenate [the EPO’s] stock”[3] and indicated that “the Office continued to reduce its stocks in 2021”[4]. The Annual Review 2022 indicates that “[the EPO] managed to keep the number of old files under control”[5]. In the EPO’s Quality Report 2022, it is said that “[the EPO’s] work has focused on dealing with the oldest files in [the EPO’s] examination stock”[6].
Again, using the EPO’s EP Bulletin Search database, based on year-end stocks of what we will call “younger” (i.e., pending for up to 3 years) and “older” (i.e., pending for 4 or more years) pending cases, it appears that the number of “older” pending cases has indeed been reduced. As seen in Figure 3, up to 2021, the stock of “older” cases fell by more than half (relative to 2013 figures), followed by a slight up-tick in 2022. Up to the end of 2020 the stock of “younger” cases changed little before rising in 2021 and 2022.
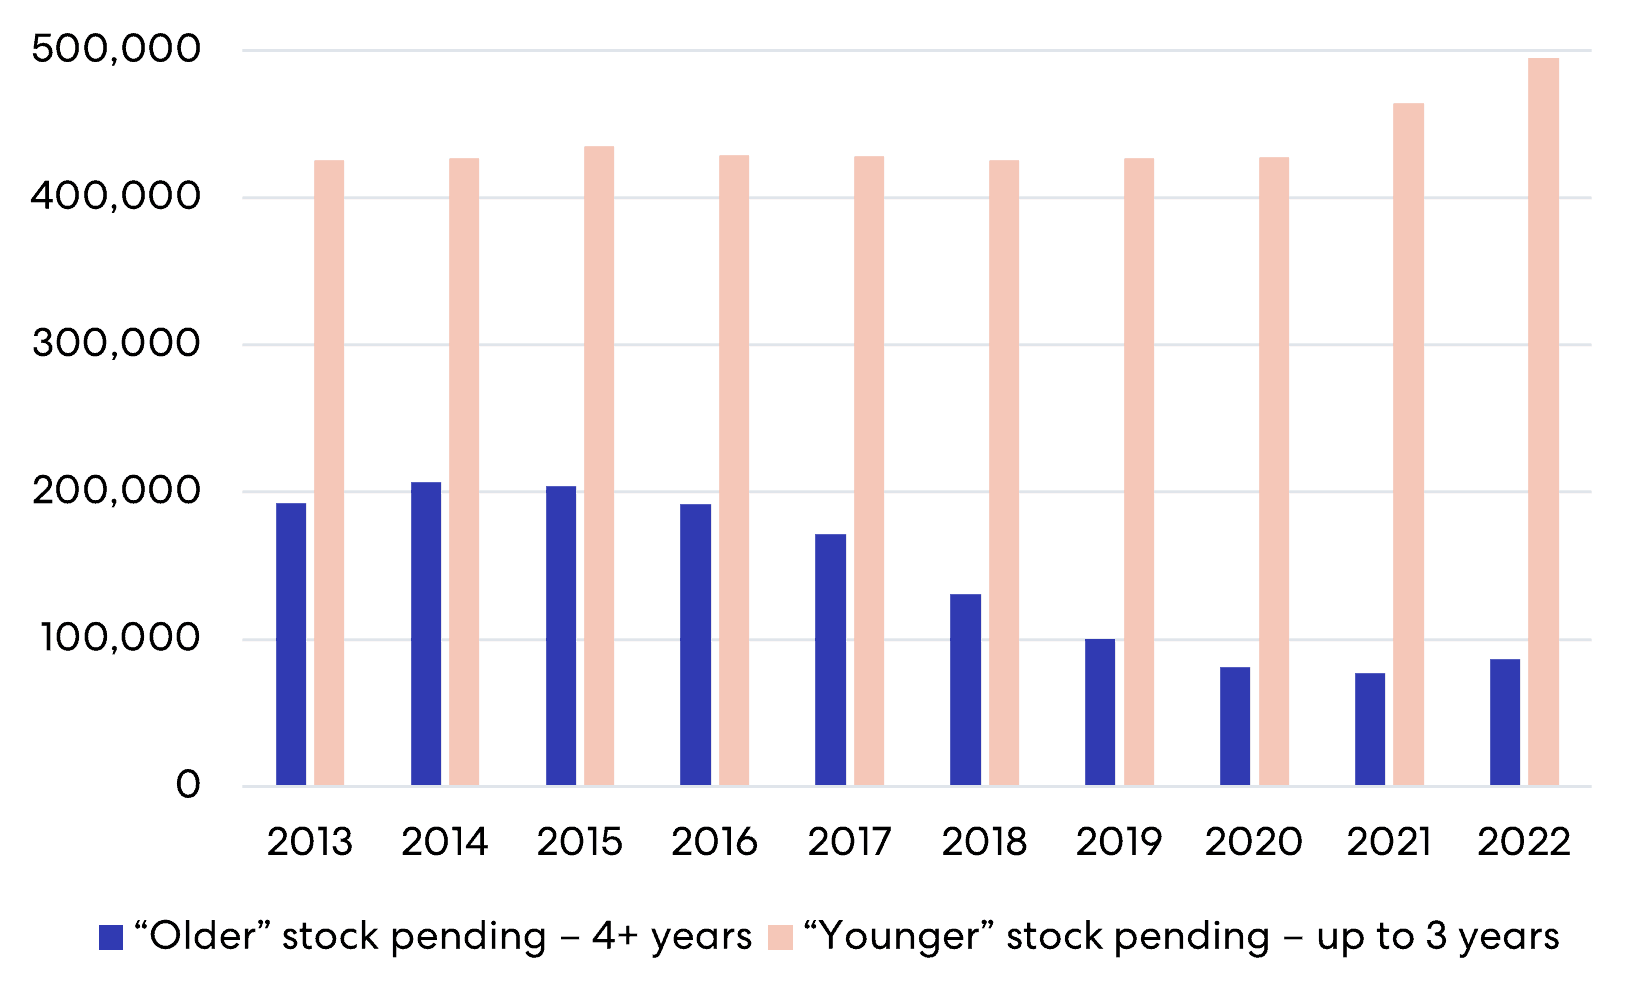
Figure 3 – Age profile of year-end stock of pending EP cases
The largest share in reductions to the stock of pending cases has been due to the numbers of cases allowed. The “age profile” of allowed cases (Figure 4, below) shows that from 2013 to 2018 almost equal and rising numbers of “older” and “younger” cases were allowed. The numbers of “younger” allowed cases peaked in 2020, but fell in 2021 and 2022. From 2019 to 2022, “older” allowed cases also fell in number, and fell well below the numbers of “younger” cases allowed. Perhaps this was at least in part because there were now proportionally fewer “older” cases available for allowance in the stock of pending EP cases?
By the end of October 2023, the number of EP cases allowed in 2023 has already well exceeded (by 20 %) the total number allowed in the whole of 2022.
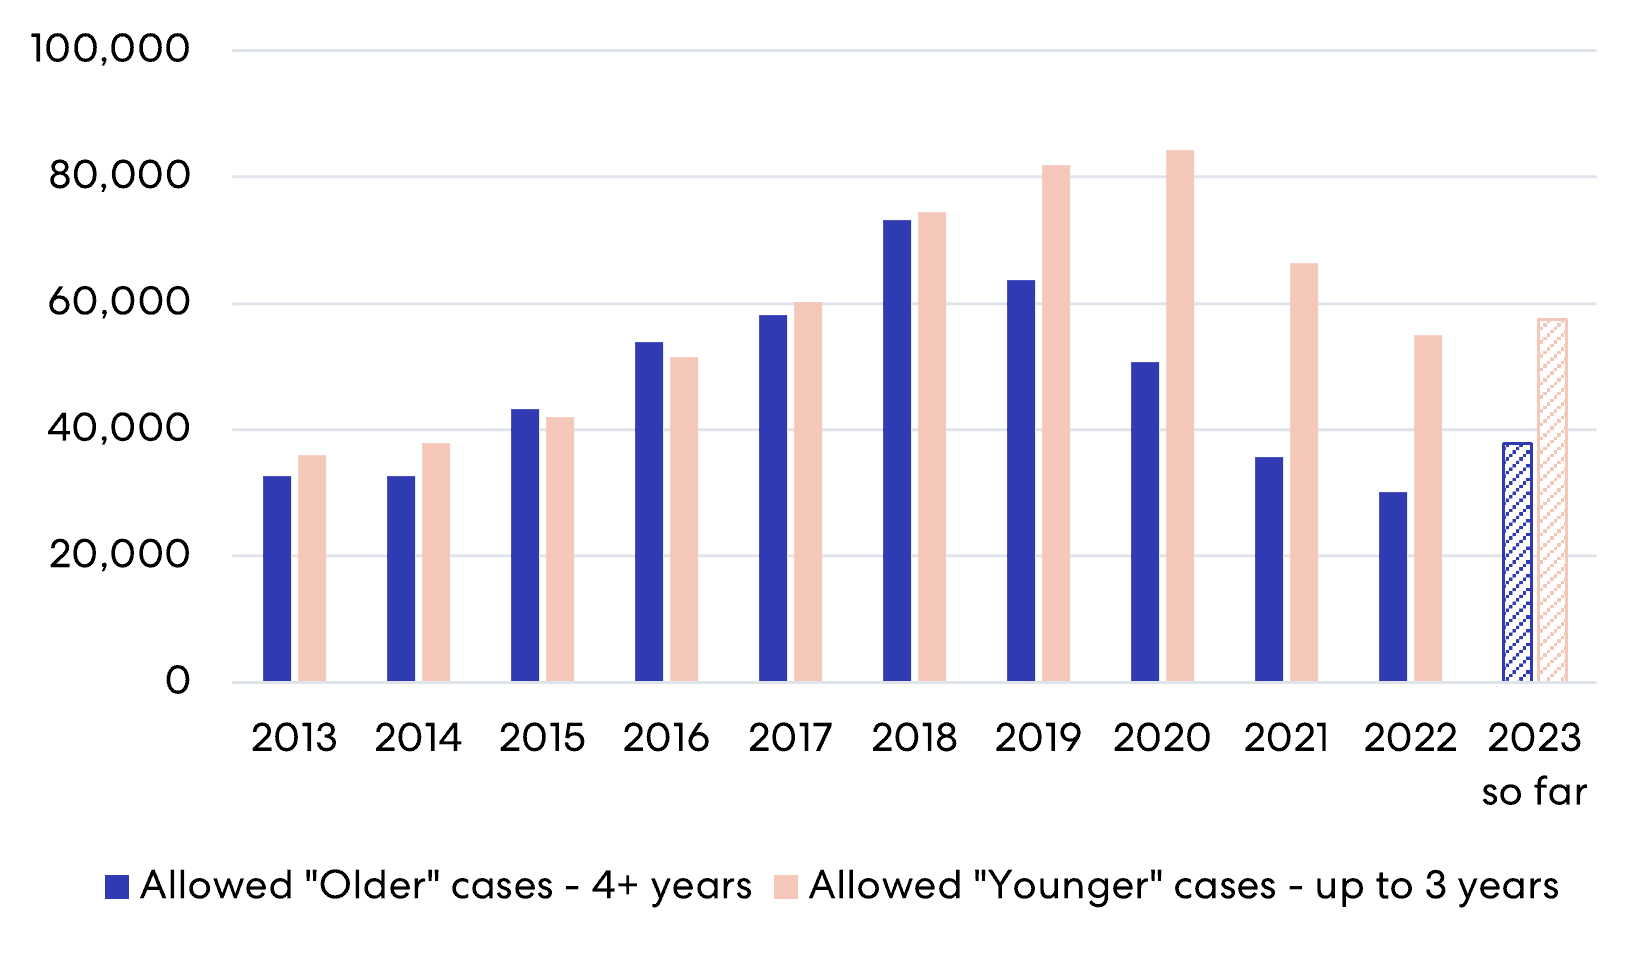
Figure 4 – Age profile of allowed EP cases
After the numbers of cases allowed, the next largest share in reductions to the stock of pending cases has been accounted for by the numbers of cases withdrawn (the term “withdrawn” is here used to cover applications positively withdrawn and applications allowed to be “deemed withdrawn”). According to the Annual Review 2021, “applicants withdrew around 8,000 fewer applications than in 2020” and the EPO comments that this “suggests that the EPO’s targeted efforts to process older files and rejuvenate our stock are paying off.”[7]. According to the Annual Review 2022, there were “7,772 withdrawals fewer than planned” in 2022[8].
The age profile of cases withdrawn (Figure 5) shows that up to 2016 more “older” cases than “younger” cases were withdrawn, in increasing numbers. Then the numbers of “older” withdrawn cases started to fall – quite remarkably so after 2018. From 2017 to 2020, the level of “younger” withdrawn cases moved upwards, but fell below the 2020 level in 2021 and 2022. Perhaps, as suggested by the comments in the EPO’s Annual Review 2021, the falls in the numbers of cases withdrawn is related to increased numbers of allowances and grants in earlier years?
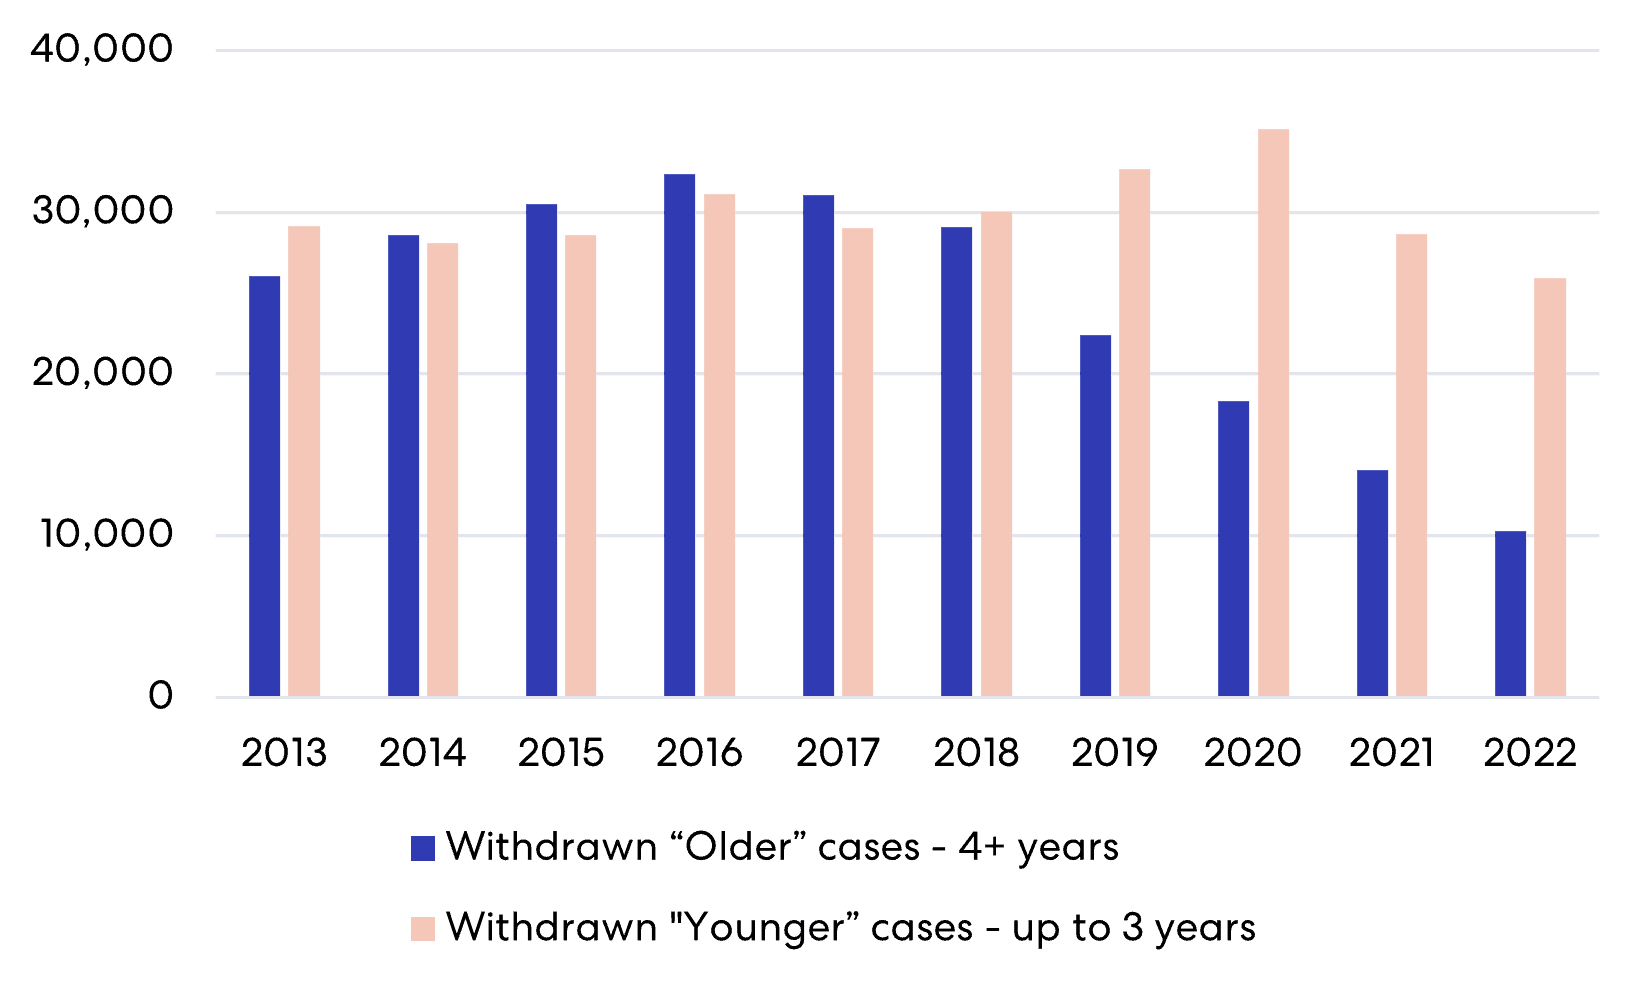
Figure 5 – Age profile of withdrawn EP cases
A minor share in reductions to the stock of pending cases has been accounted for the number of cases refused: many fewer cases are refused than cases allowed (in general around one twentieth of the number or cases allowed are refused). According to the EPO’s Annual Review 2022, the number of refusals in 2022 was “-7% versus plan”[9]. As our age profile of refused cases shows (Figure 6), as might be expected, more refused cases are “older”. The numbers of refusals of “older” cases increased year by year up to 2019 but fell in 2020 and 2021. The numbers of refusals of “younger” cases increased up to 2019 and maintained their level in 2020 and 2021.
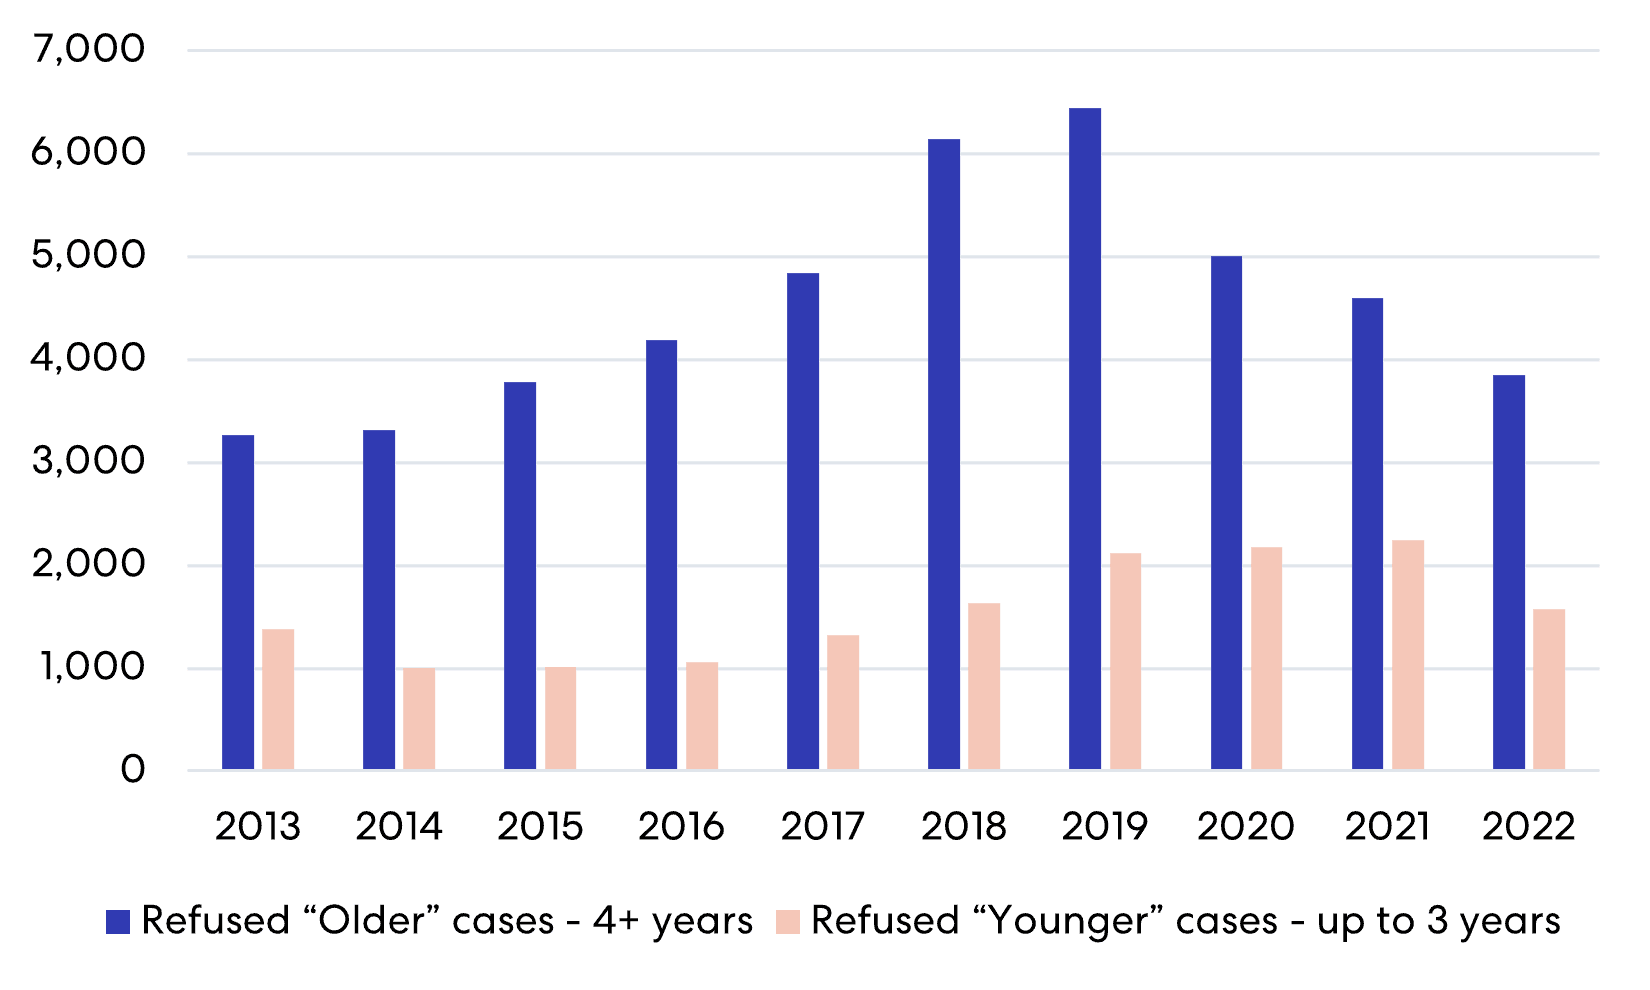
Figure 6 – Age profile of refused EP cases
The EPO do therefore appear to be routinely working through their stock of older cases. As seen in Figure 3, it is now largely “young” patent applications that make up the EPO’s stock for search and examination. But what does this mean for the EPO’s revenue streams?
Renewal
The two largest sources of revenue for the EPO are (i) national patent renewal fees from countries in which European patents are maintained in force and (ii) “internal” EPO renewal fees for pending European applications.
The EPO receives 50% of national renewal fees from each country in which a European patent is maintained in force, and in recent years this revenue has exceeded revenue from “internal” EPO renewal fees for pending European applications[10] (Figure 7). This seems to be the result of increased numbers of patent grants and changes to the stock of pending applications – “older” cases attract higher EPO renewal fees than “younger” cases, so a reduction of the stock of “older” cases might be expected to reduce the EPO’s “internal” renewal fee income more than a similar reduction in the stock of “younger” cases, while more granted “older” cases may have greater potential to increase EPO revenue from national renewal fees[11].
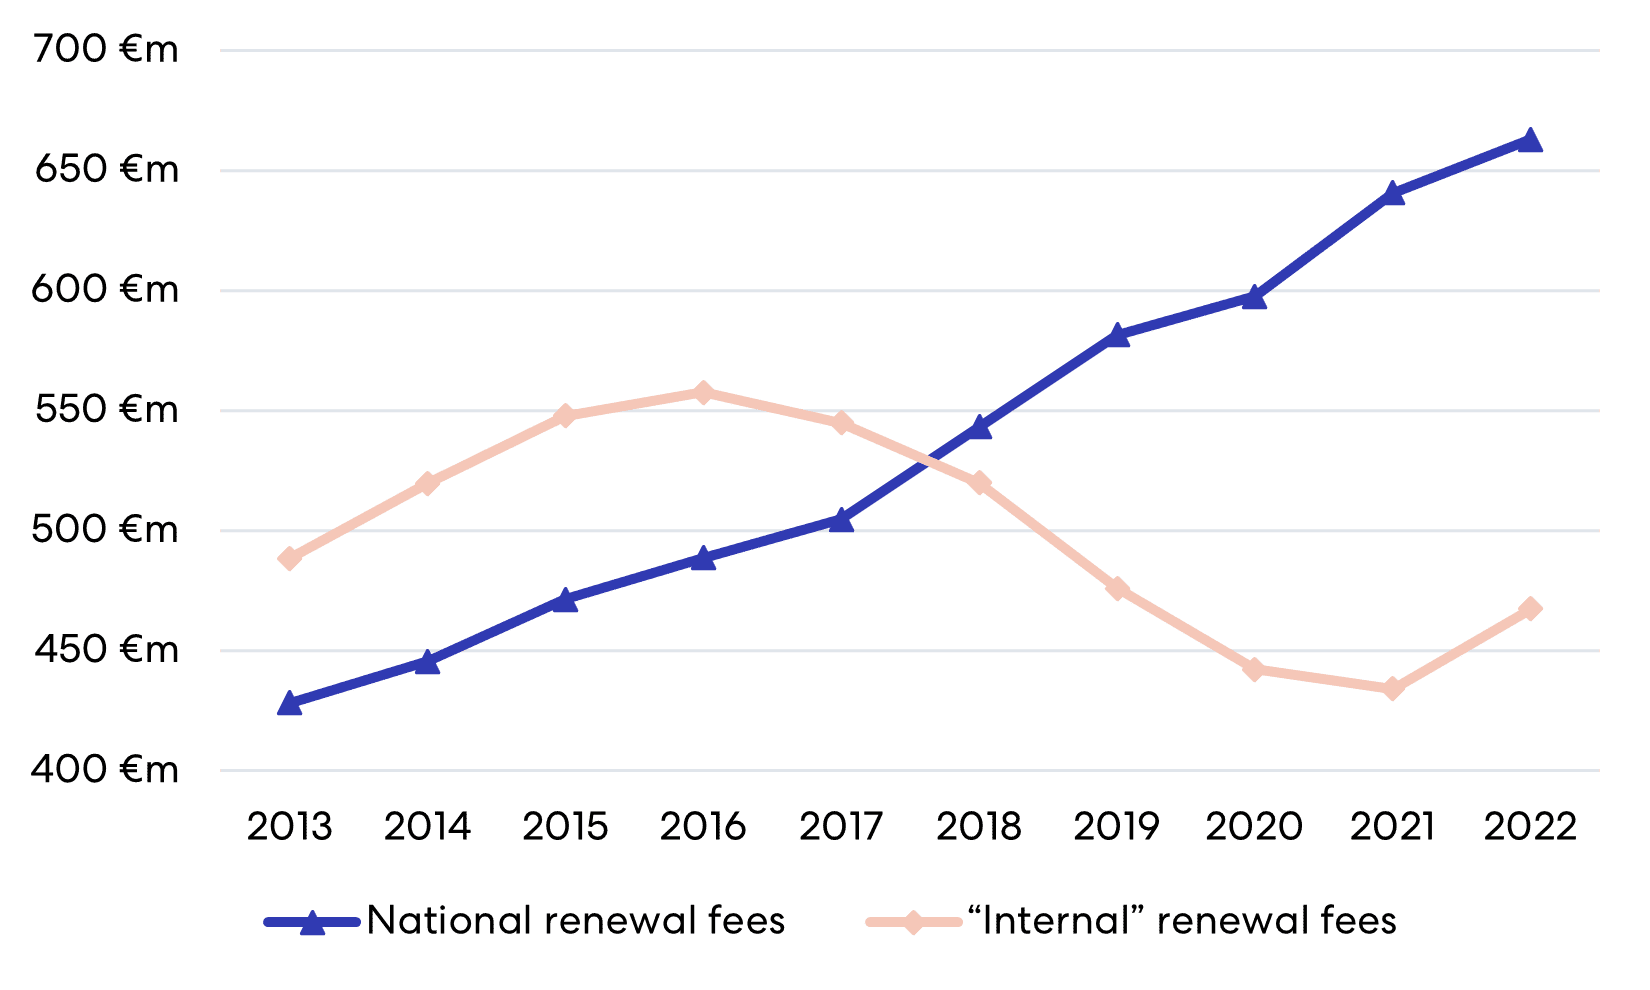
Figure 7 – EPO renewal fee revenue
In 2023, the Unitary Patent (UP) system launched, bringing potentially significant implications for the EPO’s renewal fee revenue. UPs – European patents, which have “unitary effect” – are subject to single “unitary” renewal fees rather than national renewal fees for each of the seventeen countries presently members of the UP system[12]. The “unitary” renewal fees are roughly the same as national renewal fees for the “top four” UP countries – member countries of the UP system in which European patents have most often been brought into force: Germany, the Netherlands, France, and Italy (see Figure 8 below). In a sense, renewal in the other thirteen member countries is, in effect, free.
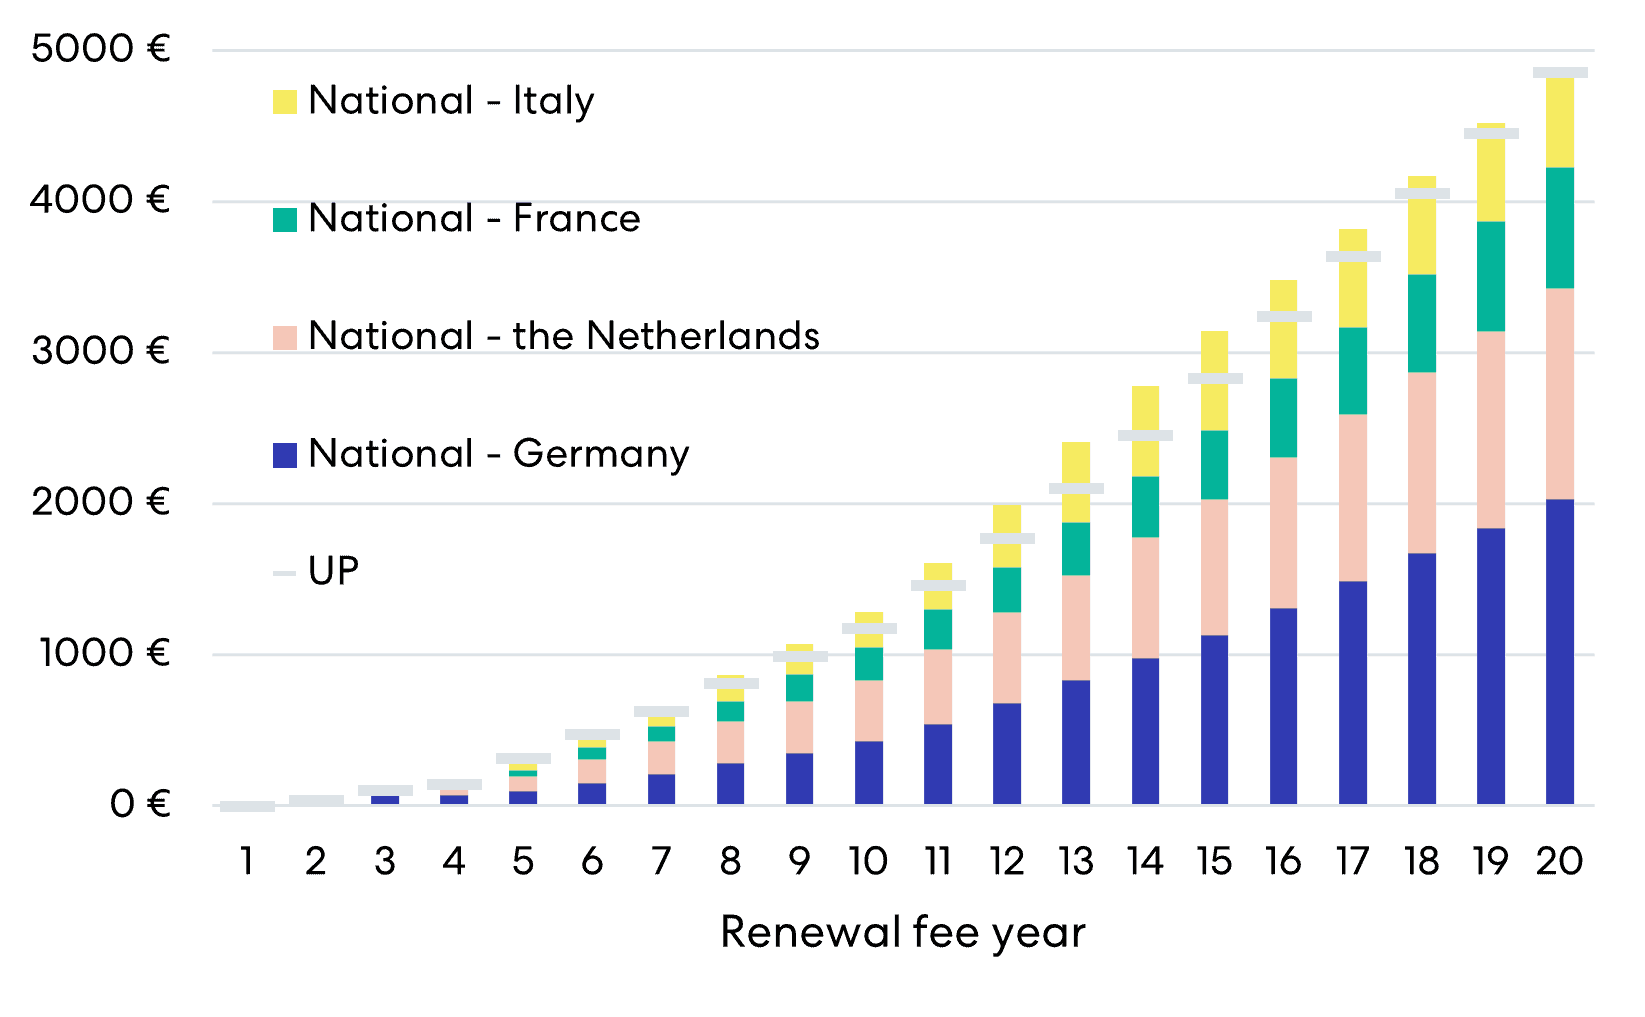
Figure 8 – Renewal fee comparison: top four UP countries via national route v. all UP countries via UP route
On the part of the applicant, it is, of course, far too early to judge whether they will favour “unitary patents”[13] and applicants’ decisions to request (or not) UPs may depend on more than whether the UP route is cheaper than the traditional “national patents” route. Although the EPO will receive 50% of renewal fees for UPs, the effect that this new system will have on the EPO’s renewal revenue – in combination with the reduction in “older” pending cases and the recent increase in grant rates – remains to be seen. There are informal proposals for applicants to face a 20-25 % increase in renewal fees in coming years (see a thorough discussion on the point here). Watch this space.
References
[1] It appears that information provided by the EPO in its Patent Index and Annual Report/Annual Review publications includes information, such as numbers of new applications, which also count applications never published by the EPO. They never appear in the “European Patents Register” or the “EP Bulletin Search” database, which relate cover only published applications. The “lost” applications are apparently withdrawn or simply abandoned by applicants (e.g. by applicants failing to pay official fees) but these applications and their fates appear nowhere in public EPO records. A reasonable estimate seems to be that around 10,000 applications filed each year are “lost”. Some of these “lost” applications perhaps serve as priority applications for other applications later filed at the EPO or elsewhere.
[2] EPO Annual Review 2022, Key Achievement: Goal 3, Increasing demand for our services, Fig. 30.
[3] EPO Annual Review 2021, Key Achievement: Goal 3, Workload and performance, Performance.
[4] EPO Annual Review 2021, Key Achievement: Goal 5, Financial sustainability, Budget and finance.
[5] EPO Annual Review 2022, Key Achievement: Goal 3, Timeliness as an essential element of quality.
[6] EPO Quality Report 2022, 5. Improving quality at every stage of the PGP, 5.3. Examination, 5.3.1. Metrics: examination and final actions, Examination timeliness, p47.
[7] EPO Annual Review 2021, Key Achievement: Goal 3, Workload and performance, Incoming workload.
[8] EPO Annual Review 2022, Key Achievement: Goal 3, Workload and performance, Increasing demand for our services, Production statistics.
[9] EPO Annual Review 2022, Key Achievement: Goal 3, Workload and performance, Increasing demand for our services, Production statistics.
[10] EPO Financial Statements 2022, 3. Revenue from contracts with customers, 3.1. Revenue from patent and procedural fees and other revenue, 3.2. Procedural fees related to the patent grant process.
[11] EPO Annual Review 2021, Key Achievement: Goal 5, Financial sustainability, Budget and finance: “Income from internal renewal fees was down EUR 8.0 million (1.8%) as the Office continued to reduce its stocks in 2021. However, the decrease in internal renewal fees was more than offset by growth in national renewal fees of EUR 43.1 million (7.2%) versus 2020, driven by the number of grants in recent years.”
[12] Austria, Belgium, Bulgaria, Denmark, Estonia, Finland, France, Germany, Italy, Latvia, Lithuania, Luxembourg, Malta, the Netherlands, Portugal, Slovenia, Sweden.
[13] From 1 June 2023 to September 2023, the EPO’s “Unitary Patent” dashboard indicates that 8510 requests for “unitary effect” had been received.
This is for general information only and does not constitute legal advice. Should you require advice on this or any other topic then please contact hlk@hlk-ip.com or your usual HLK advisor.


