EPO – New Patent Applications and Patent Grants 2020
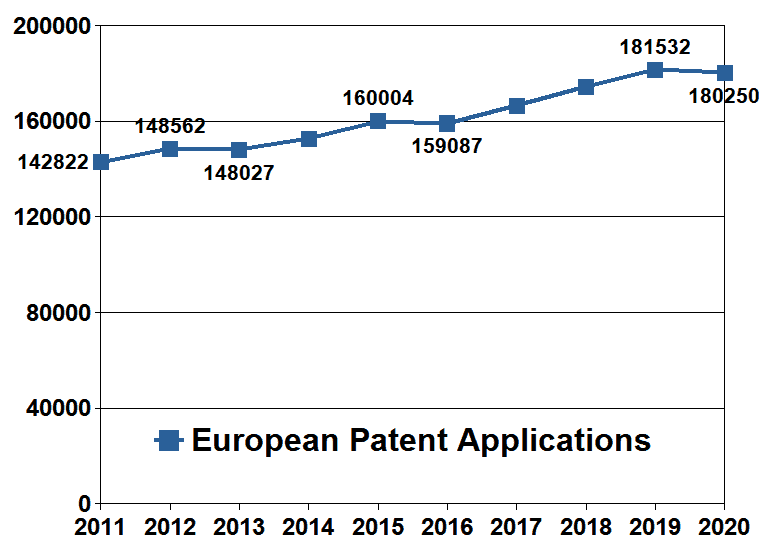
After a period of moderate growth the number of new European patent applications received by the EPO in 2020 fell slightly (1282 new applications or 0.7% less than in 2019). This is a surprisingly good result given the unusual circumstances that prevailed throughout most of 2020. Overall, looking back over a decade, the number of new European patent applications filed in 2020 was 25% higher than the number filed in 2011.
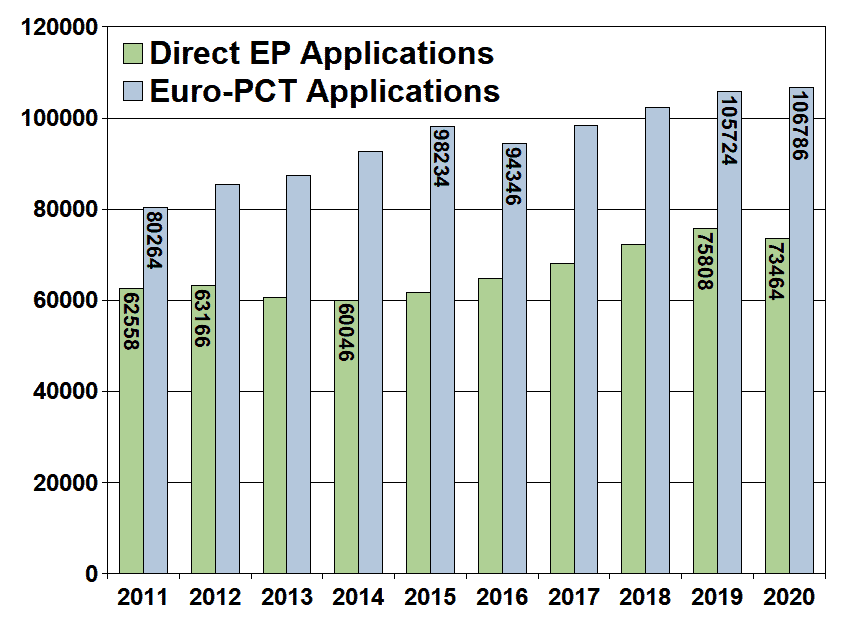
Total new European applications are made up of so-called Euro-PCT applications (applications filed by way of the PCT route and which entered the European phase in the year concerned) and Direct EP applications (applications filed without use of the PCT route). All divisional applications, even if they are divisionals of Euro-PCT applications, count as Direct EP applications.
The number of new Direct EP applications received by the EPO in 2020 fell by 2344 or 3.1% compared to 2019. The number of Euro-PCT applications increased by 1062 or 1.0% compared to 2019.
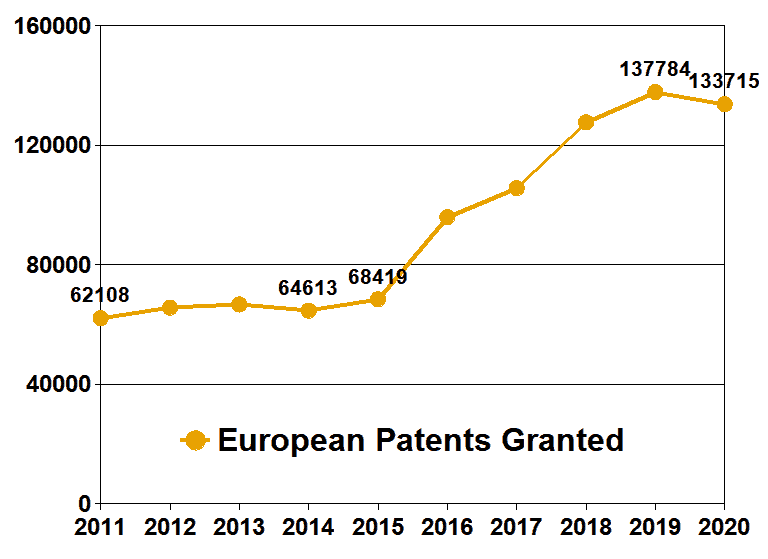
The number of European patents granted in each year increased by 100%, i.e. doubled, from 2015 to 2019 but in 2020 fell by 4069 or 3.0% compared to 2019.
EPO - Top Applicants 2020
The top 50 applicants in 2020 accounted for one third of European patent applications in 2020. 39 were also in the top 50 in 2019 and 27 were in the top 50 in 2011.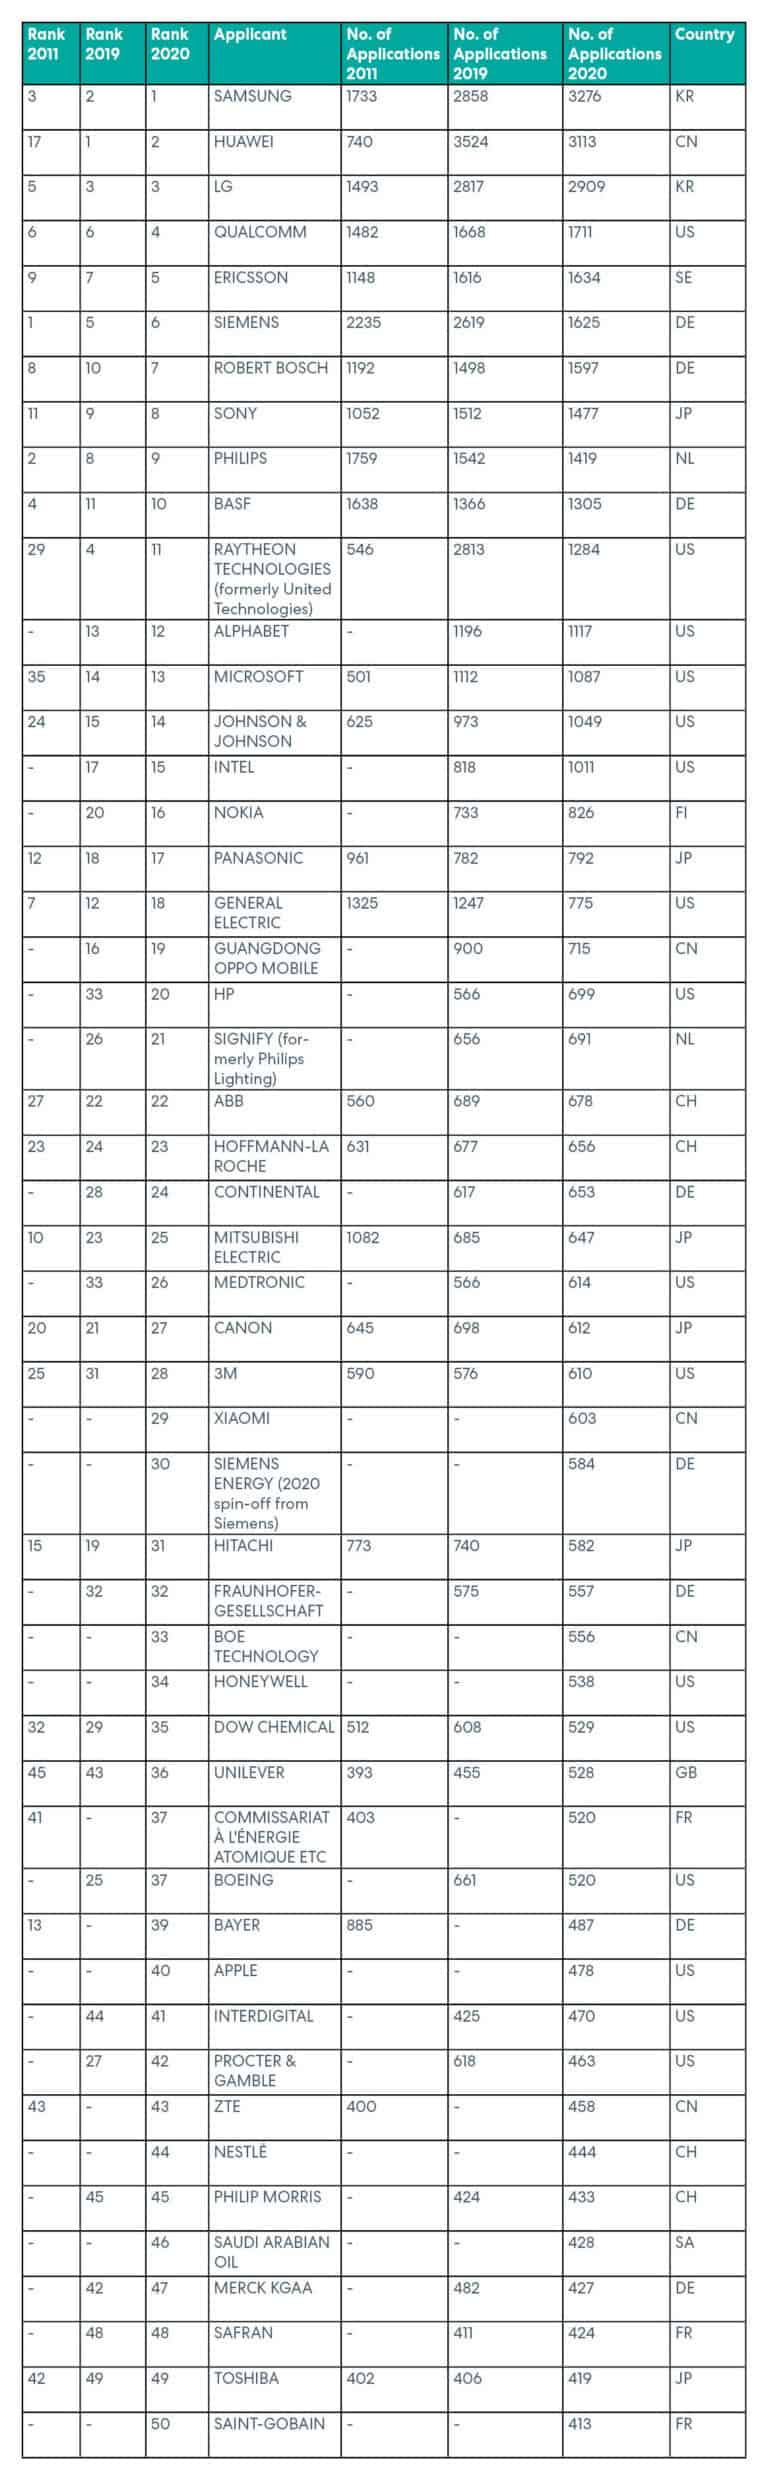
EPO – Top Countries 2020
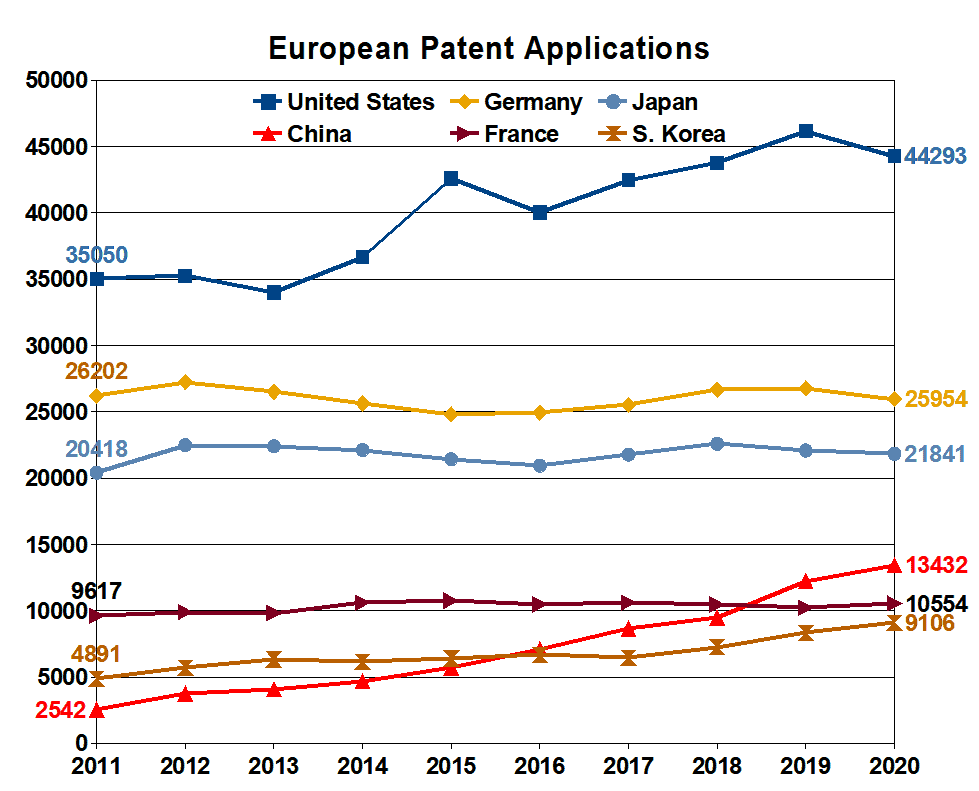 Applicants from six countries account for 70% of European patent applications. The remaining 30% are filed by applicants from around 170 countries. Taking into account that trends are likely to have been somewhat depressed in 2020, applicants from three of the top six countries have filed applications at more or less the same level, year by year, over the last decade. Applicants from the other three countries (US, China, S. Korea) have shown a trend of increasing numbers of applications year by year.
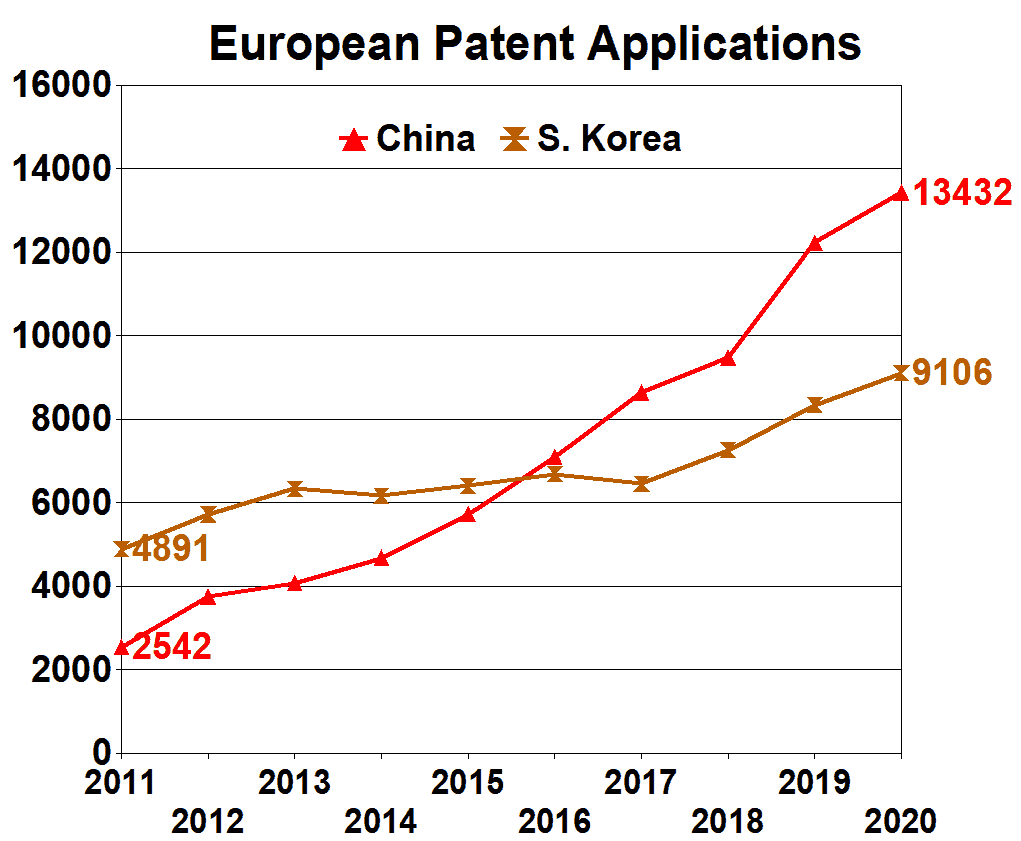
Applications by US applicants increased by 9243 =26% from 2011 to 2020. Applicants by Korean applicants increased by 4215=71%. Applications by Chinese applicants increased by 10890=428% from 2011 to 2020.
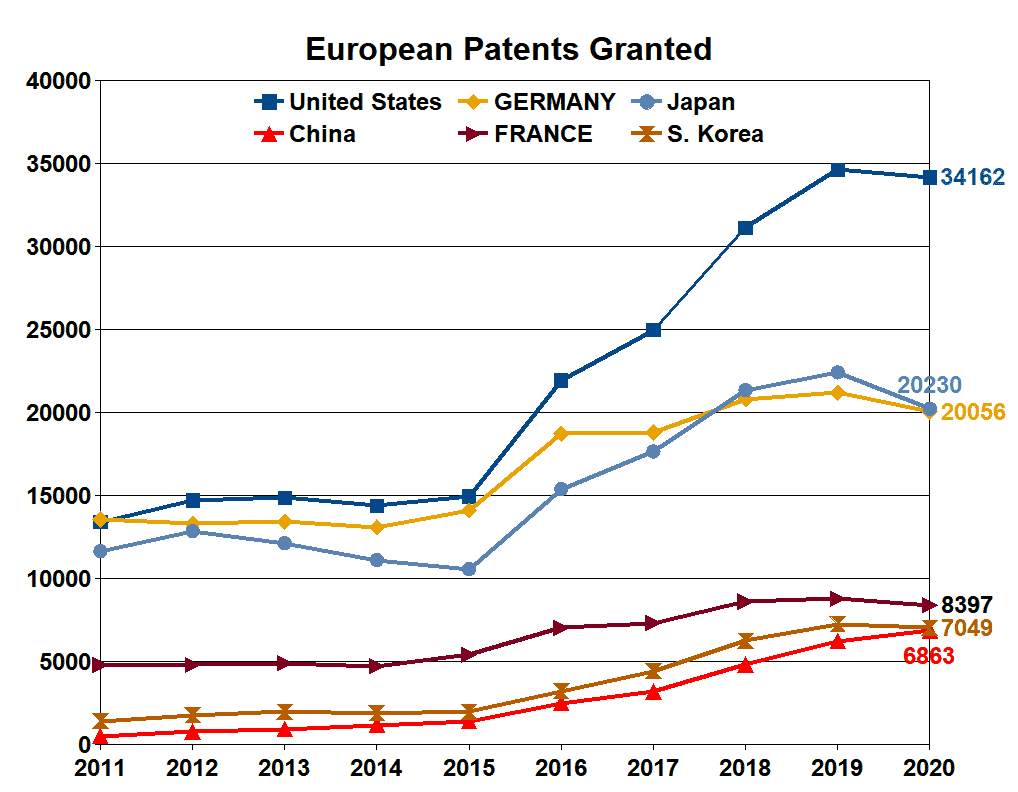
Overall, EPO patent grants increased by 95% from 2015 to 2020. Applicants from the top six countries also enjoyed increases in grants. However, patent grants for three countries increased by less than 95% (Germany 42%, France 55%, Japan 91%).
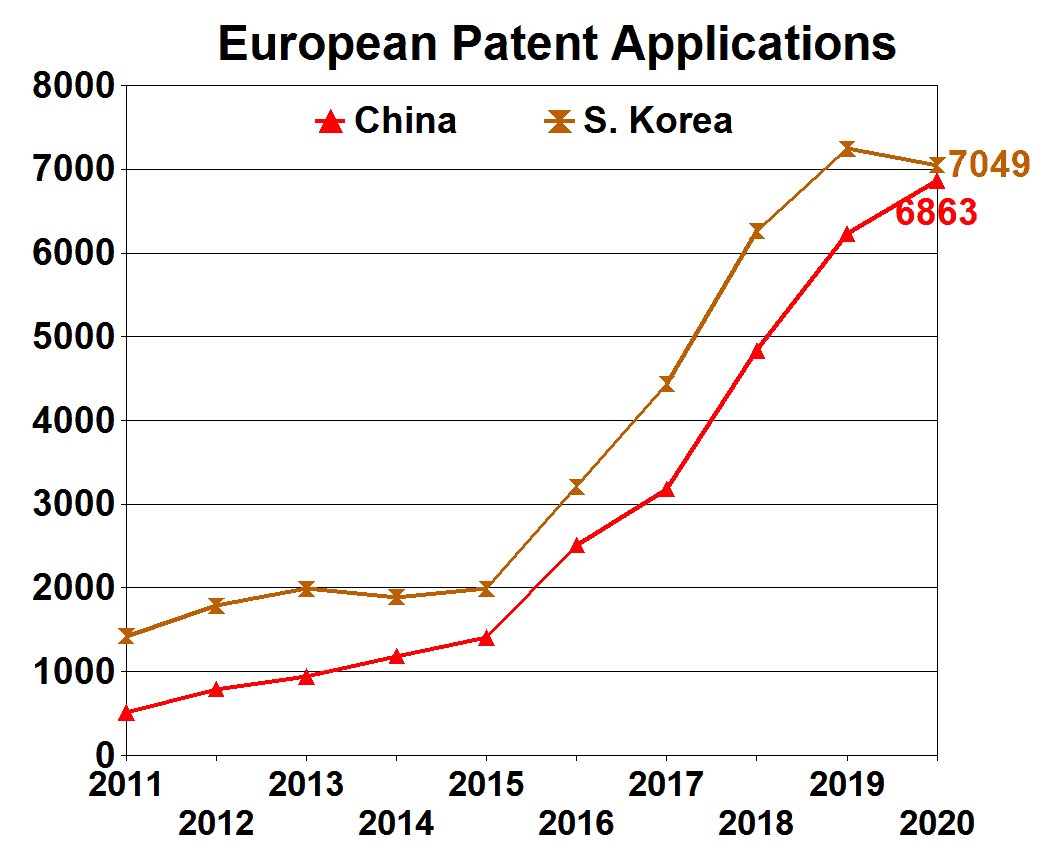
Grants to US applicants increased by 128% from 2015 to 2020. Grants to Korean applicants increased by 254%. Grants to Chinese applicants increased by 398% from 2015 to 2020.
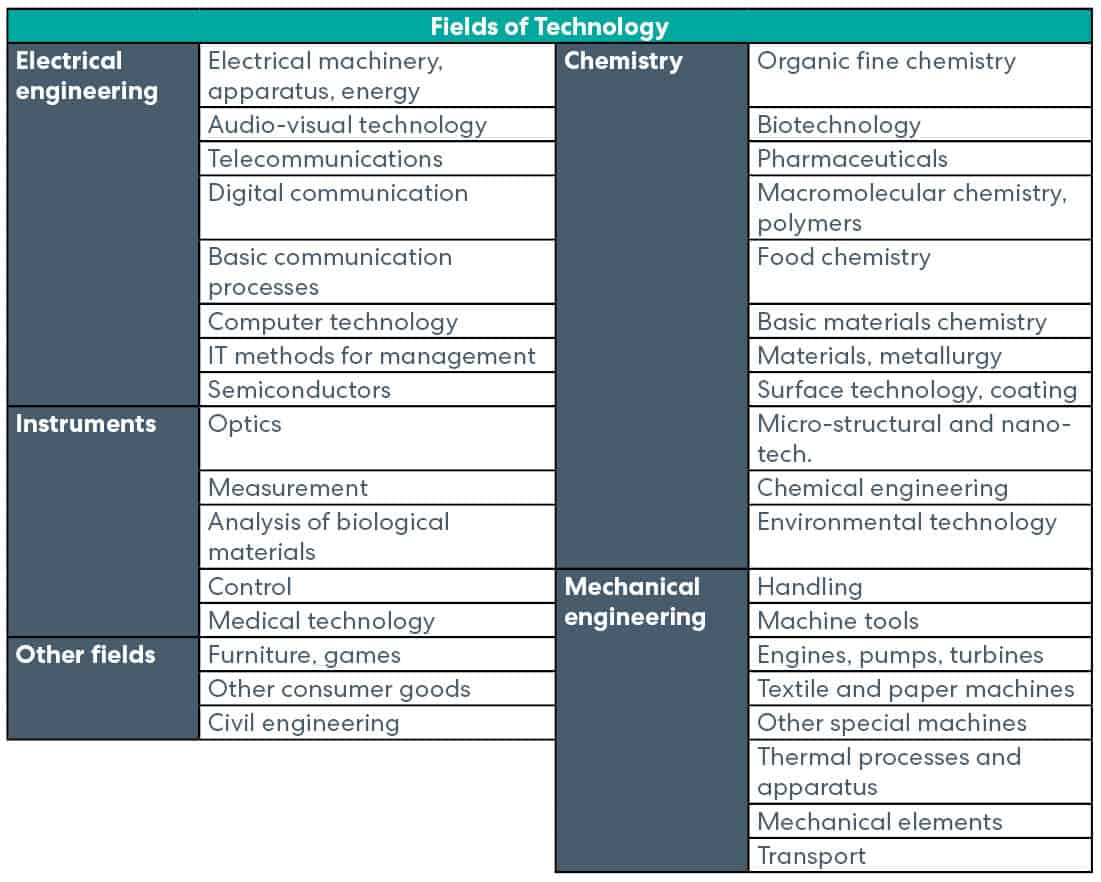
EPO – Top Fields of Technology 2020
The EPO divides applications into 35 fields of technology across five broad areas based on the WIPO IPC technology concordance. In terms of numbers of new European patent applications the top four fields, in 2020 and in 2011, were medical technology, digital communication, computer technology and electrical machinery, apparatus, energy.
Overall, new European patent applications increased by 25% from 2011 to 2020. Applications in 12 fields of technology increased by more than 25%, with applications in 6 of those fields increasing by over 50%. In 7 fields of technology fewer new applications were filed in 2020 than in 2011.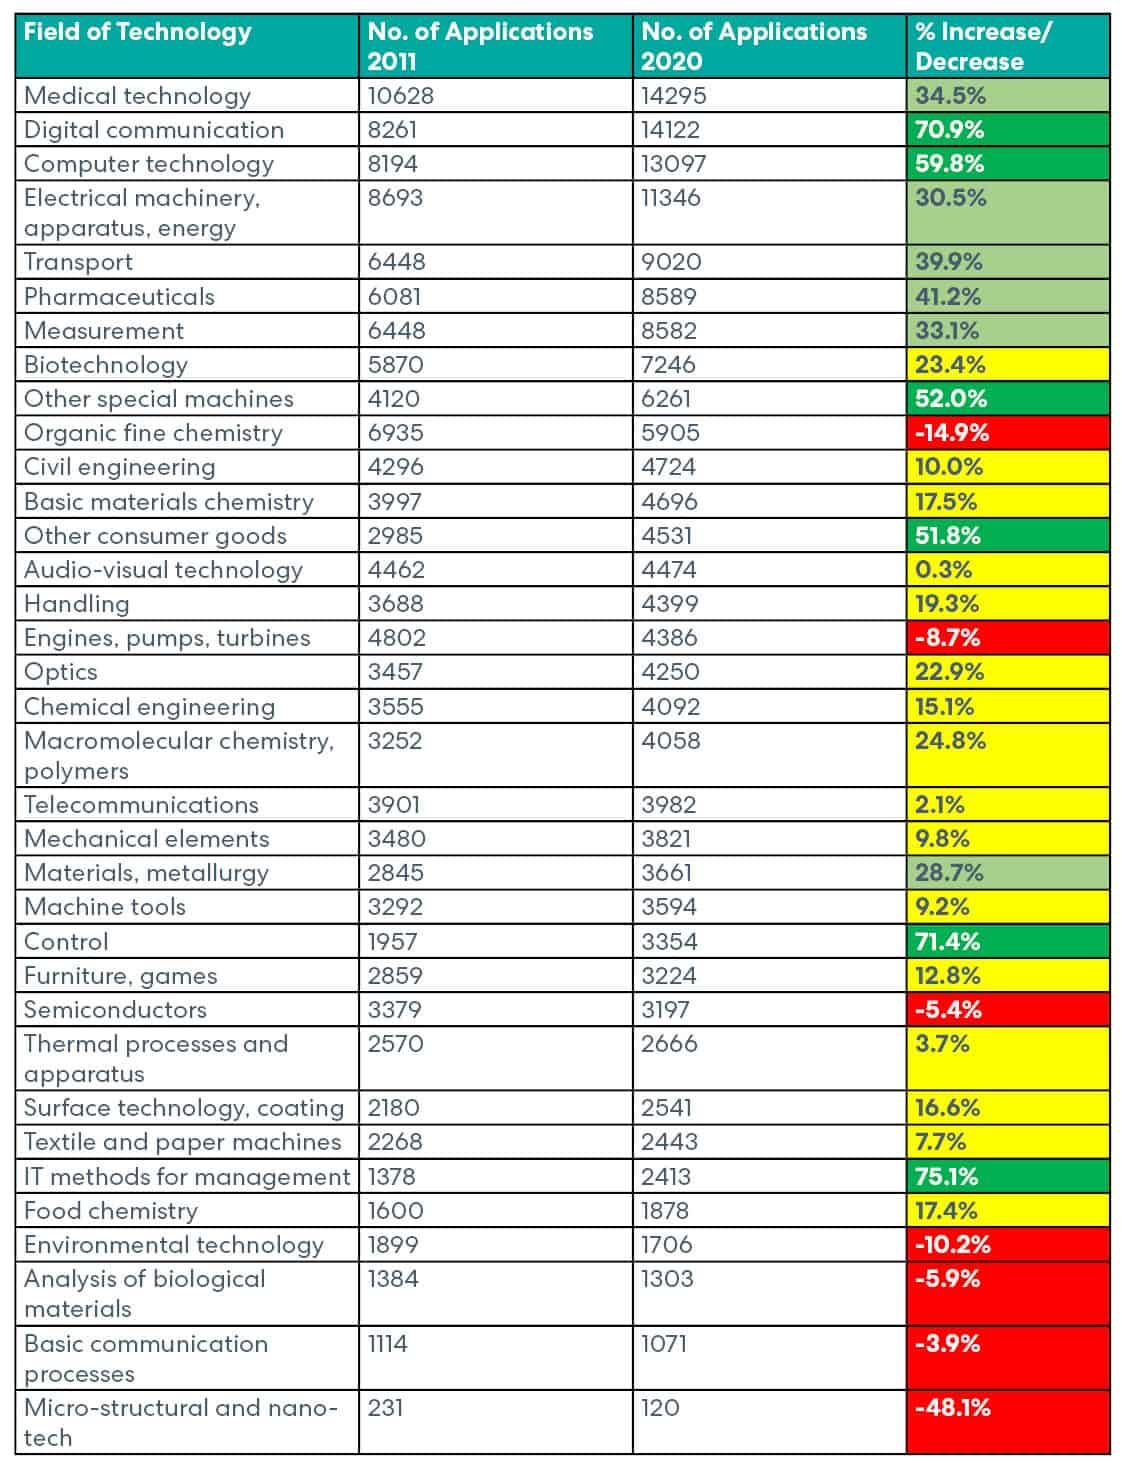
This is for general information only and does not constitute legal advice. Should you require advice on this or any other topic then please contact hlk@hlk-ip.com or your usual Haseltine Lake Kempner advisor.